After your professor runs and publishes a period, you have access to a full breakdown of what actually happened. This is where learning compounds.
Results live in four tabs, so your own numbers never get tangled up with market data or competitor intel:
| Tab | What's there |
|---|---|
| General Results | Your headline P&L, your STR indices, your owner KPI cards, and the Performance Trend chart — the executive view (6.1) |
| Daily Results | The detailed day-by-day breakdown and OTB (on-the-books) for upcoming months (6.2–6.3) |
| Market Intel | How the market looks — the competitor pricing grid and the Compset, with your compset first (6.4) |
| Month in Progress | The open period day by day, if your sim uses pace mode (6.5) |
There's also a ⬇ Download Excel button available on every one of these screens (6.6).
6.1 The P&L Summary
Your headline page is the P&L Summary — a full profit & loss for the published period.
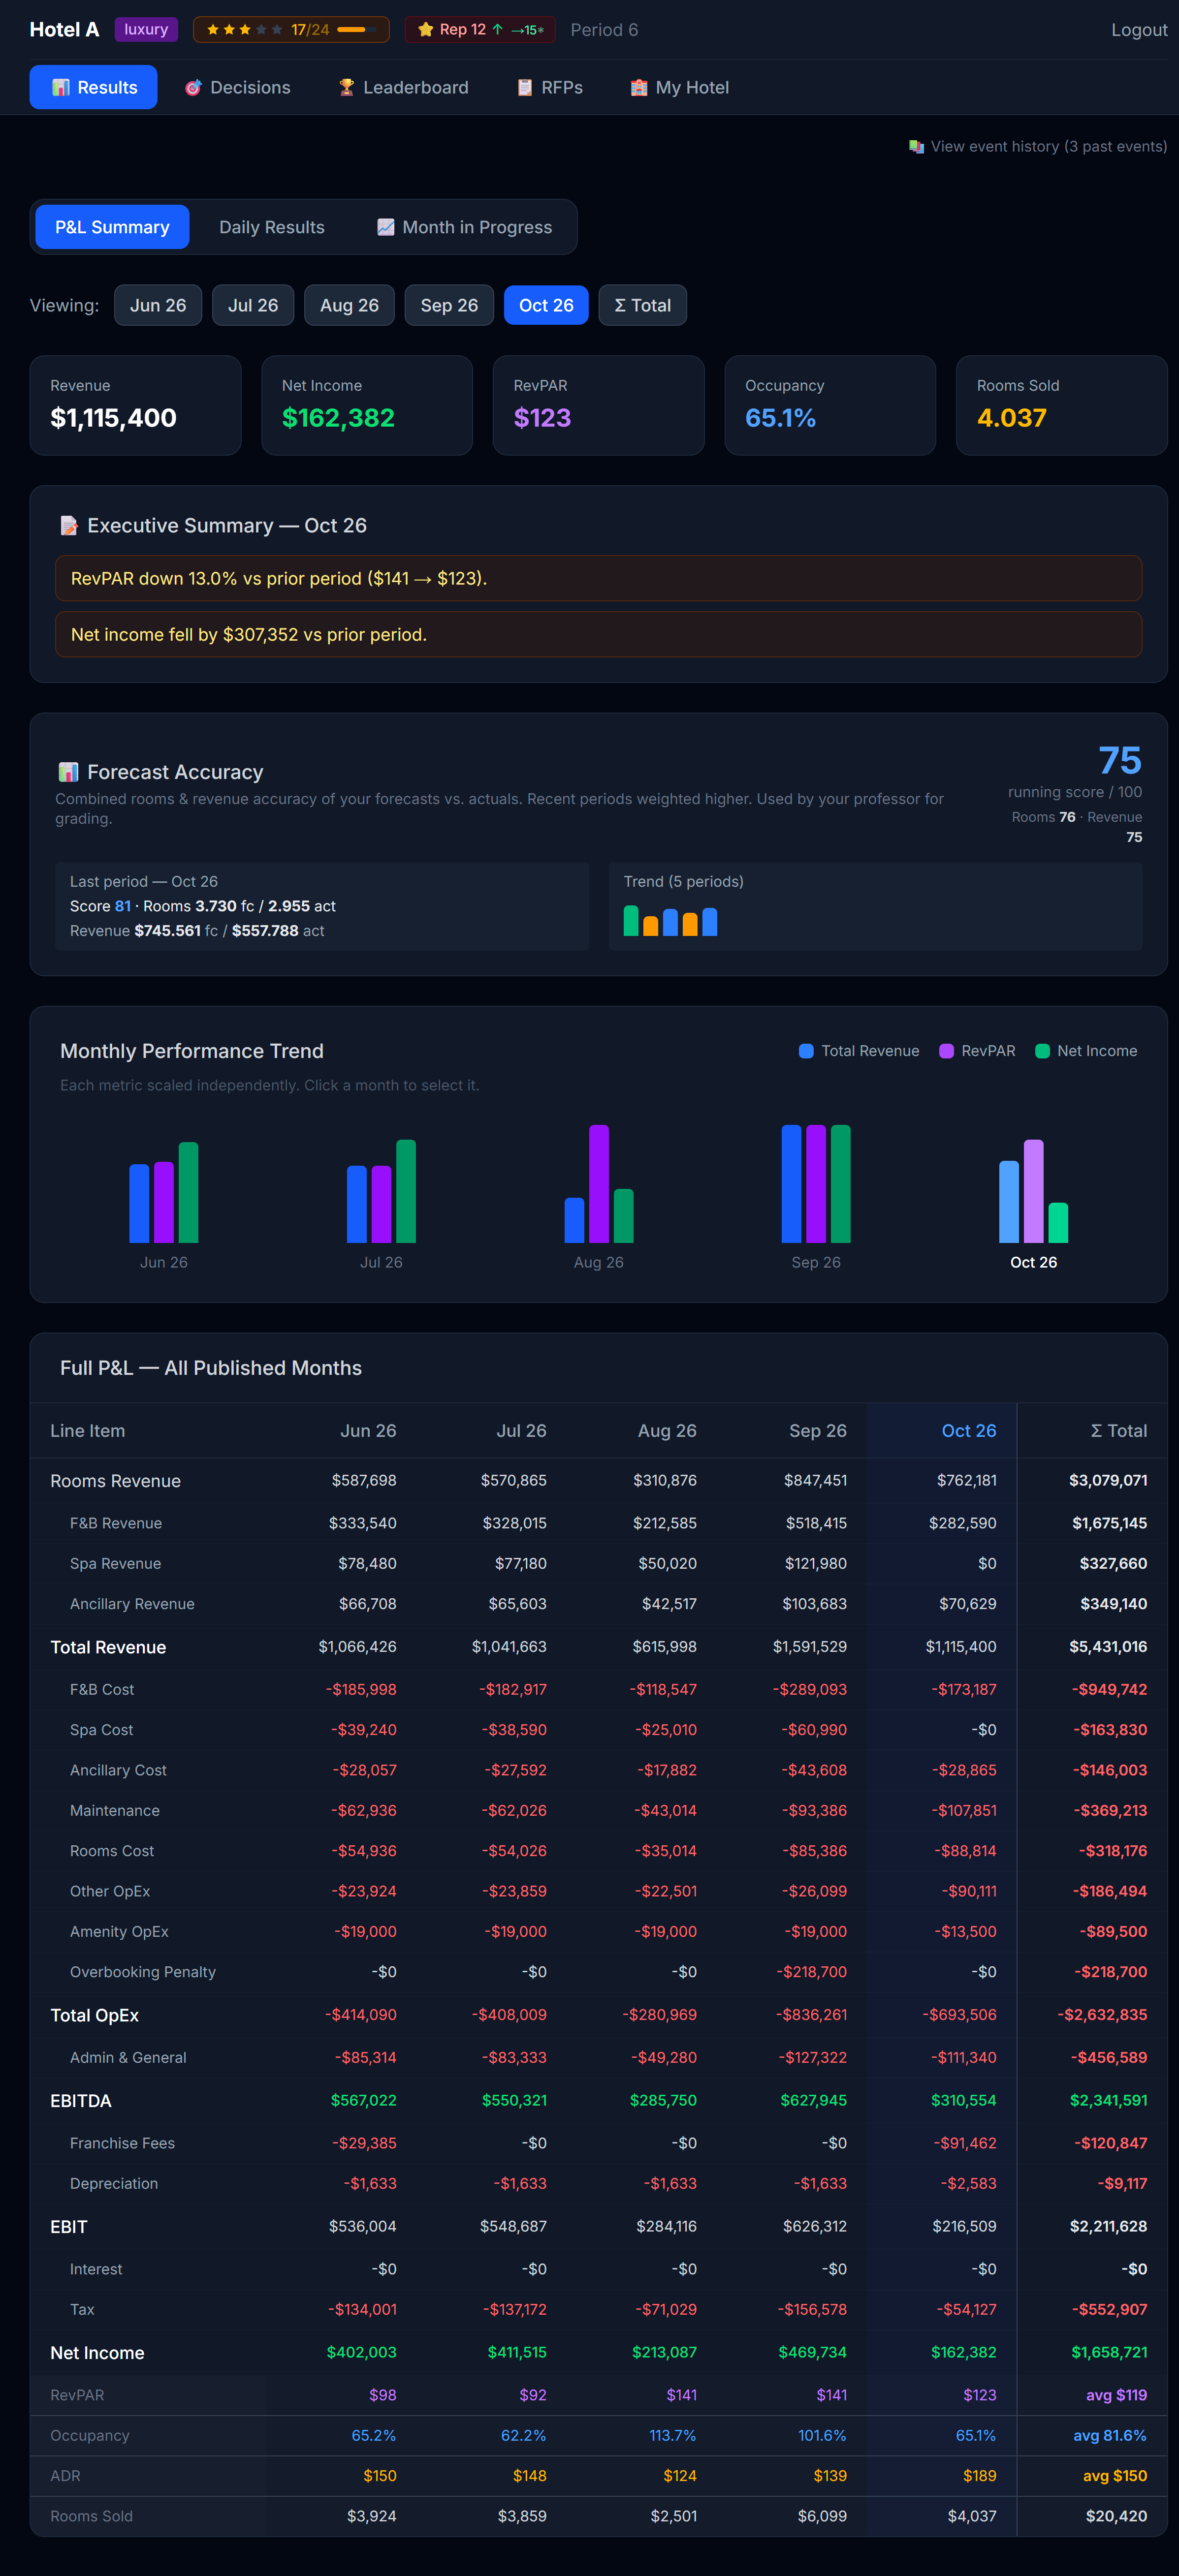 The P&L summary. Read top-to-bottom — revenue, then costs, then profit.
The structure
| Section | What's in it |
|---|---|
| Revenue | Room revenue (split by segment + room type) + amenity revenue |
| Variable costs | Distribution channel commissions, marketing, walk-cost penalties |
| Operating costs | Maintenance, rooms cost, other OpEx, amenity OpEx, brand / loyalty fees |
Marketing is its own line now. It used to be folded into Other OpEx; it's now broken out as a Marketing line with two sub-lines beneath it:
| Sub-line | What it is |
|---|---|
| Campaigns | What your marketing campaigns cost this period (one-time launch + monthly) |
| Market Research | What you spent on the Compset (Chapter 4) — the intel you bought about competitors |
So when you buy Market Research, you can see exactly what it cost you, right next to what it bought you. | Financial items | Loan interest, revolver interest (if used), reserve contributions | | Bottom line | Operating profit, then Pre-tax profit |
What to look for, in order
- Total revenue — did you hit your forecast? If under, was it occupancy (volume) or ADR (price)?
- Channel costs — what % of revenue went to commissions? If it's climbing, your OTA mix is heavy.
- Marketing — did the campaigns pay for themselves? You won't always know immediately — Baseline campaigns build over time.
- Operating profit — your headline number. This is what counts toward your competitive ranking.
- Pre-tax profit — after financial items (interest, reserve). The number that drives your cash position.
A losing month isn't wasted — tax relief
If your hotel loses money in a month, that loss isn't thrown away: it accumulates as a tax credit. In later profitable months, your taxes are reduced until the accumulated losses are used up. When that happens, your P&L shows a "Tax relief applied (prior losses)" line, so you can see the relief working in your favor.
This mirrors how real companies treat Net Operating Losses — a bad month still hurts, but it softens your tax bill down the road. It's one more reason not to panic after a rough period: recover your profitability and part of that pain comes back to you as lower taxes.
STR Indices — how you compare to the market
On the Results page you also see your STR Indices for the selected period: three benchmark scores that tell you how you did versus the market (all hotels combined), not just in absolute terms.
| Index | What it is | 100 means |
|---|---|---|
| MPI — Market Penetration | Your Occ% ÷ market Occ% × 100 | You filled at the market's rate |
| ARI — Average Rate Index | Your ADR ÷ market ADR × 100 | You charged the market's average price |
| RGI — Revenue Generation | Your RevPAR ÷ market RevPAR × 100 | You earned the market's average per available room |
Above 100 = ahead of the comp set; below 100 = behind. RGI matters most — it blends price and occupancy, so it's the truest "did I win?" score. A hotel can post a high ARI (premium pricing) but a low MPI (empty rooms) and land at a mediocre RGI.
💡 A note on the math: occupancy and RevPAR always divide by your hotel's physical room count — the real, fixed capacity of your property — times the days in the period. Closing rooms for maintenance or holding inventory back doesn't shrink that denominator, so you can't inflate your RevPAR just by releasing fewer rooms for sale.
💡 You also get a live STR inside Month in Progress (6.4), computed over the days closed so far — so you can see how you're tracking vs the market before the month ends.
Owner KPI cards — how the business is really doing
Below your STR indices, General Results also shows a row of owner KPI cards. These are private to your team — no competitor ever sees your version of these, and you never see theirs. Hover any card for a tooltip with its exact definition; the short version:
| KPI | What it measures |
|---|---|
| TRevPAR (Total Revenue per Available Room) | Every revenue stream — rooms, F&B, spa, any other ancillary income — divided by your available room-nights. Broader than RevPAR because it counts more than just the room sale. |
| GOPPAR (Gross Operating Profit per Available Room) | Your EBITDA divided by available room-nights. This is profitability, not just revenue — a hotel can have a strong TRevPAR and a weak GOPPAR if costs are out of control. |
| CPOR (Cost Per Occupied Room) | Your total operating costs plus admin, divided by occupied rooms. Lower is more efficient — you're running a leaner operation per room you actually sell. |
| Flow-through | How much of a change in revenue turned into a change in EBITDA versus the prior period. A healthy flow-through is typically 35 to 60 percent — meaning a good chunk of extra revenue drops to the bottom line instead of being eaten by costs. There's no flow-through number on your very first period, or on a lifetime/all-periods aggregate, since it needs a prior period to compare against. |
These four cards round out the picture your P&L and STR indices already give you: TRevPAR and GOPPAR tell you about the whole business (not just rooms), CPOR tells you about cost discipline, and flow-through tells you whether your recent decisions are actually compounding into profit.
The Performance Trend chart
Below the KPI cards sits the Performance Trend chart — a line chart that replaces the old bar-chart view of your monthly numbers. From Period 1 onward it always plots two lines for whichever KPIs your professor has enabled: your own hotel and "CompSet (mercado)", the whole market's average, STR-style.
For owner KPIs specifically (TRevPAR, GOPPAR, CPOR, flow-through), the chart only ever draws your own-hotel line — there's no market average to compare against, because those numbers are private to each team and nobody's individual profit is ever shown to a rival.
Your professor may also turn on up to two optional layers:
- Direct competitors (your pick). If enabled, you'll get a mandatory pop-up the first time you open any page in the simulator, asking you to choose at least 3 direct competitors from the market. You can't dismiss it without confirming a selection, and once you confirm, the choice is final for the rest of the simulation — choose thoughtfully, based on who you actually consider your competitive set. Once confirmed, the chart adds one extra line: the average of the competitors you picked. You still never see any single rival's individual numbers, only the average of your chosen group.
- Direct competitors (simulator's pick). Your professor can also turn on a second line, labeled something like "El simulador considera que tus competidores directos son: X, Y, Z" — the simulator's own suggested set of direct competitors for your hotel (which your professor can review and edit before publishing). This is separate from your own pick above; you may see one, both, or neither depending on what your professor has enabled.
Together, these let you read your trend two ways: against the whole market, and against the specific rivals you (or the simulator) think matter most.
6.2 Daily Breakdown — the granular view
The Closed Month tab on Daily Results shows every day of the period, side by side.
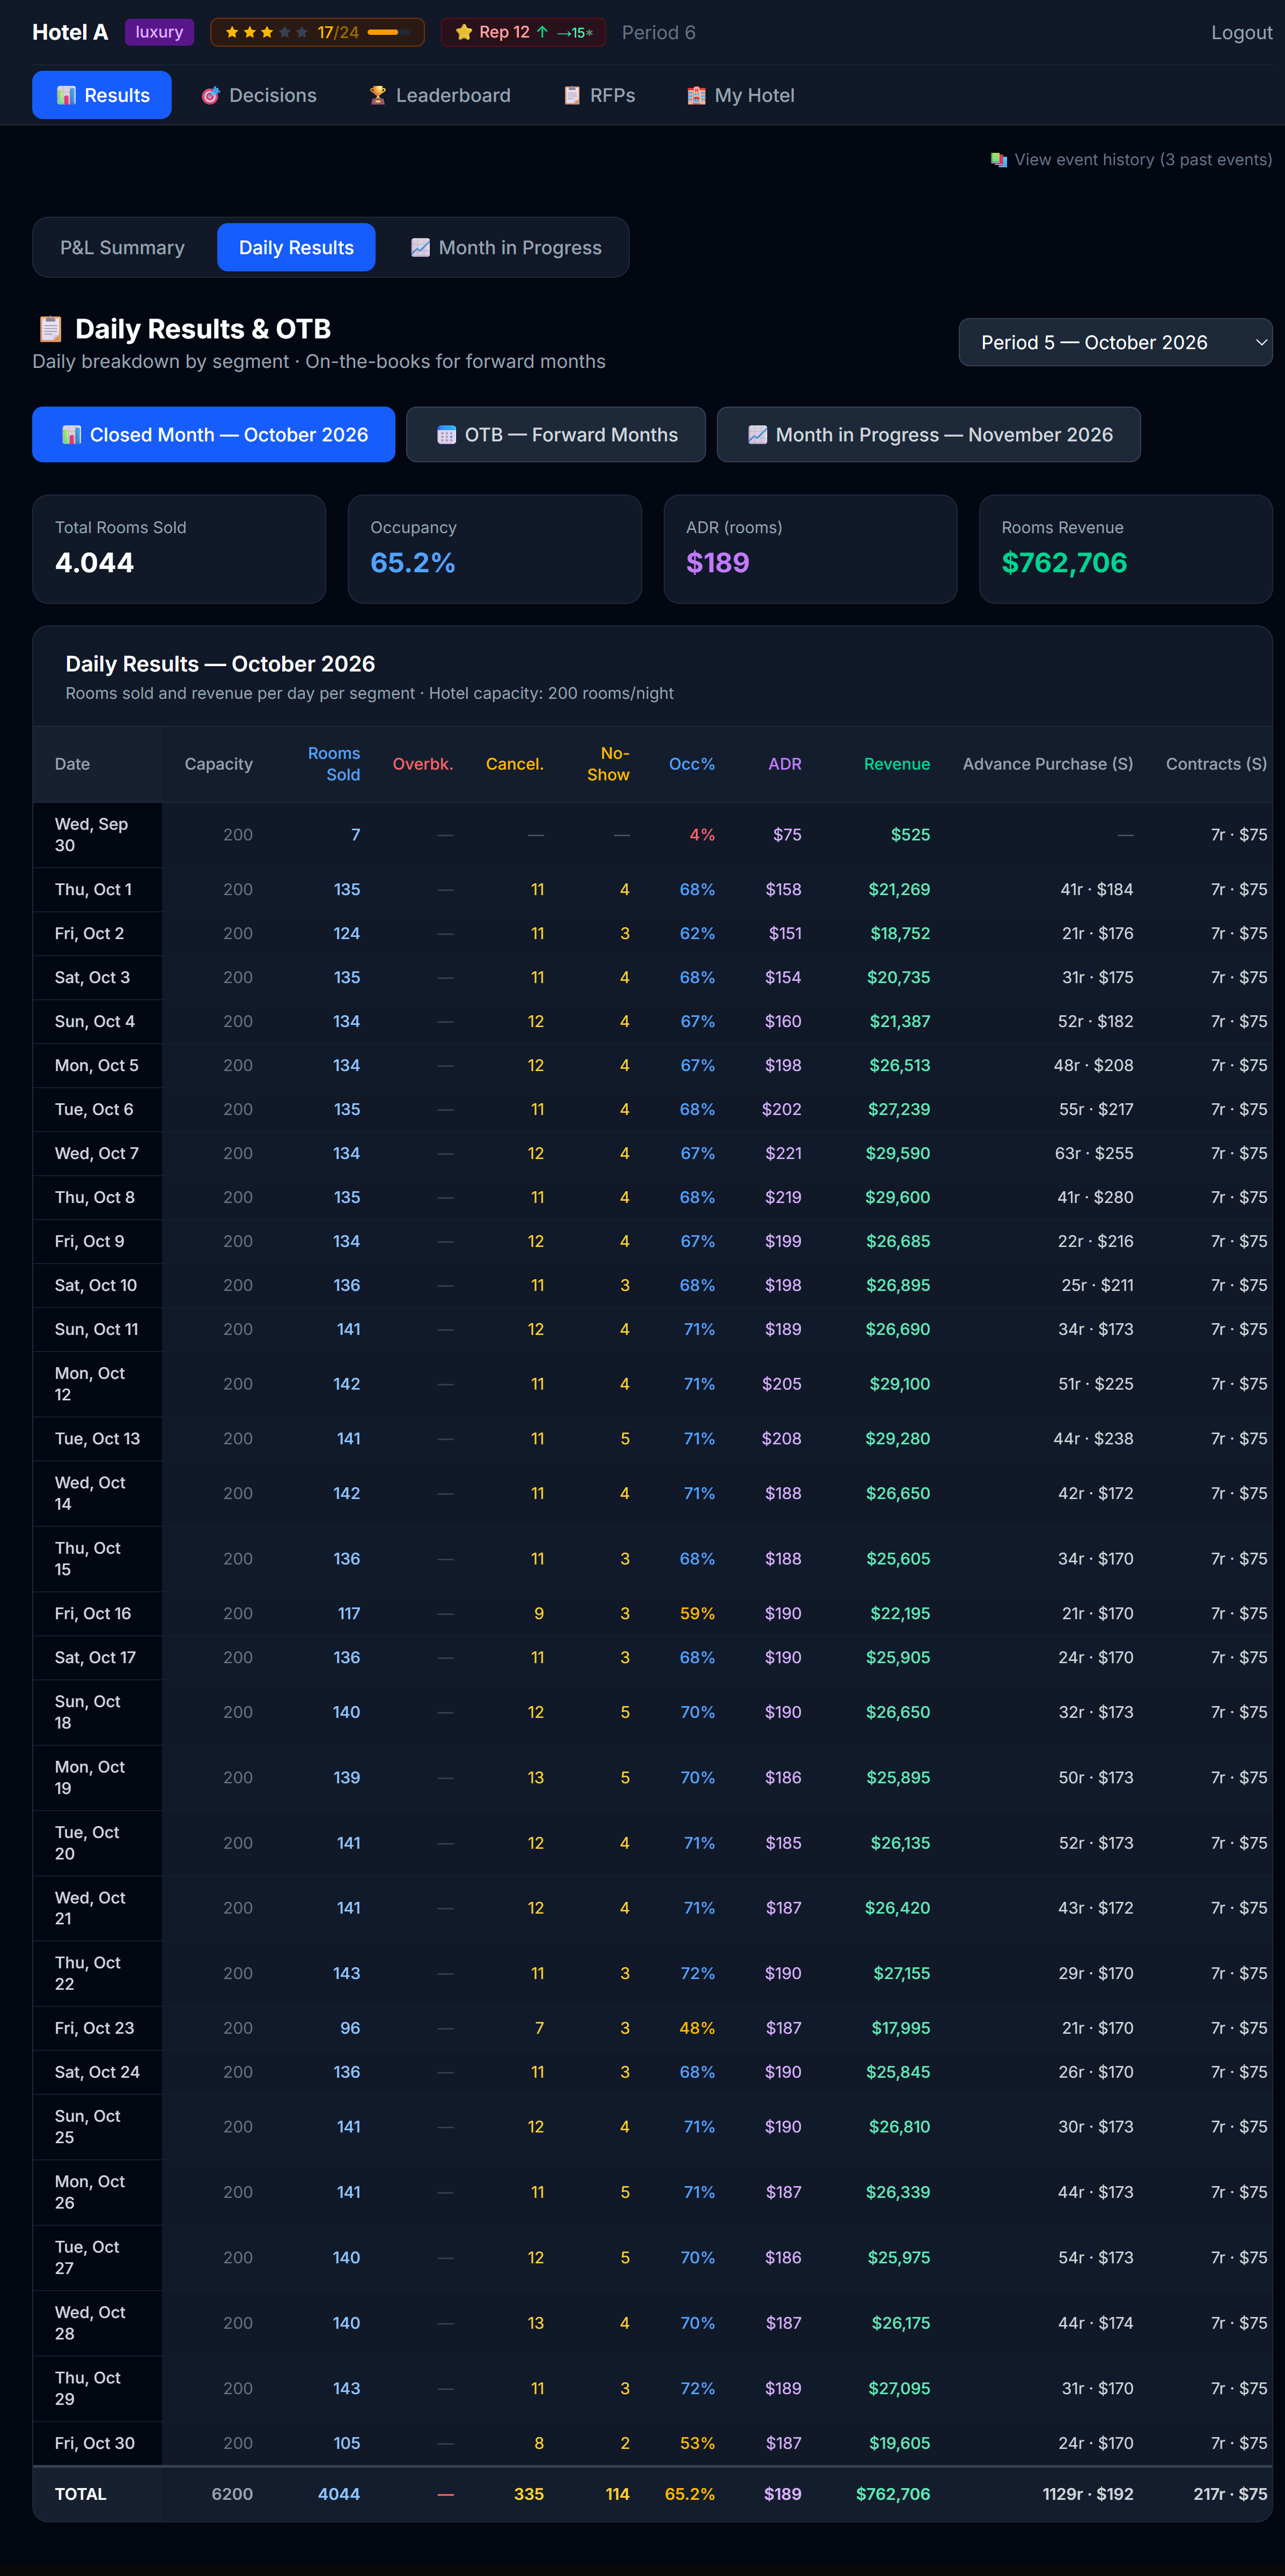 Every day, every column. The detail view.
Two controls sit above the table:
- A metric toggle — Rooms Sold / ADR / Revenue — that switches what every cell shows. One metric at a time, so the table stays readable.
- A ▸ Segments button that expands or collapses the per-segment detail. Collapsed (the default) you see only the summary columns; expanded you also get one column per segment.
Everything is split by room type: a blue (S) marks Standard, a purple (P) marks Premium.
In Rooms mode the columns (left to right) are:
| Column | What it tells you |
|---|---|
| Date / DOW | The day |
| Físico S / P (Physical) | Your physical Standard and Premium rooms — real capacity, fixed |
| Disp. S / P (Available) | The transient rooms you released that day, per room type. Turns red ⚠ if you sold more than your physical of that type (you oversold/overbooked) |
| Per-segment columns (when expanded) | Retail, Advance Purchase, Corporate, Groups, Contracts — each split (S)/(P) |
| Std total / Prem total | Rooms sold by room type, summed across every segment |
| Overbk. / Cancel. / No-Show | Walked guests (sold beyond physical), cancellations, no-shows |
| Occ% | Sold ÷ physical capacity, capped at 100% |
| Total | Total rooms sold that day |
In ADR and Revenue modes the inventory and operational columns hide (an average rate or a revenue figure has no "inventory"), and every remaining cell — per segment, Std total, Prem total, Total — shows the average rate or the revenue instead. So you can read your rate mix and your revenue mix by room type with the same toggle.
The four diagnostic questions
For each day where something looked off, ask:
- Did I sell out? (occupancy = 100%) → I underpriced. Estimate how much I left on the table.
- Did I overbook? → I priced much too low, or I held back too little inventory. Walk-cost penalties show up on the P&L.
- Did I sit half-empty? (occupancy < 50%) → I overpriced or my product is too weak for the market that day.
- Did my ADR collapse? → Too many low-segment bookings (AP / corporate) vs higher-paying retail. Maybe I should have priced retail higher to push the mix up.
💡 The diagnostic happens at the day level, not the month level. A month with 75% occupancy could be 30 days of 75% or 15 days at 100% and 15 days at 50% — wildly different stories. Always drill in.
6.3 OTB — forward visibility
The OTB (On-The-Books) tab shows you bookings already on the books for future months — meaning corporate contracts, group blocks, and advance-purchase bookings that have been confirmed but not yet "stayed."
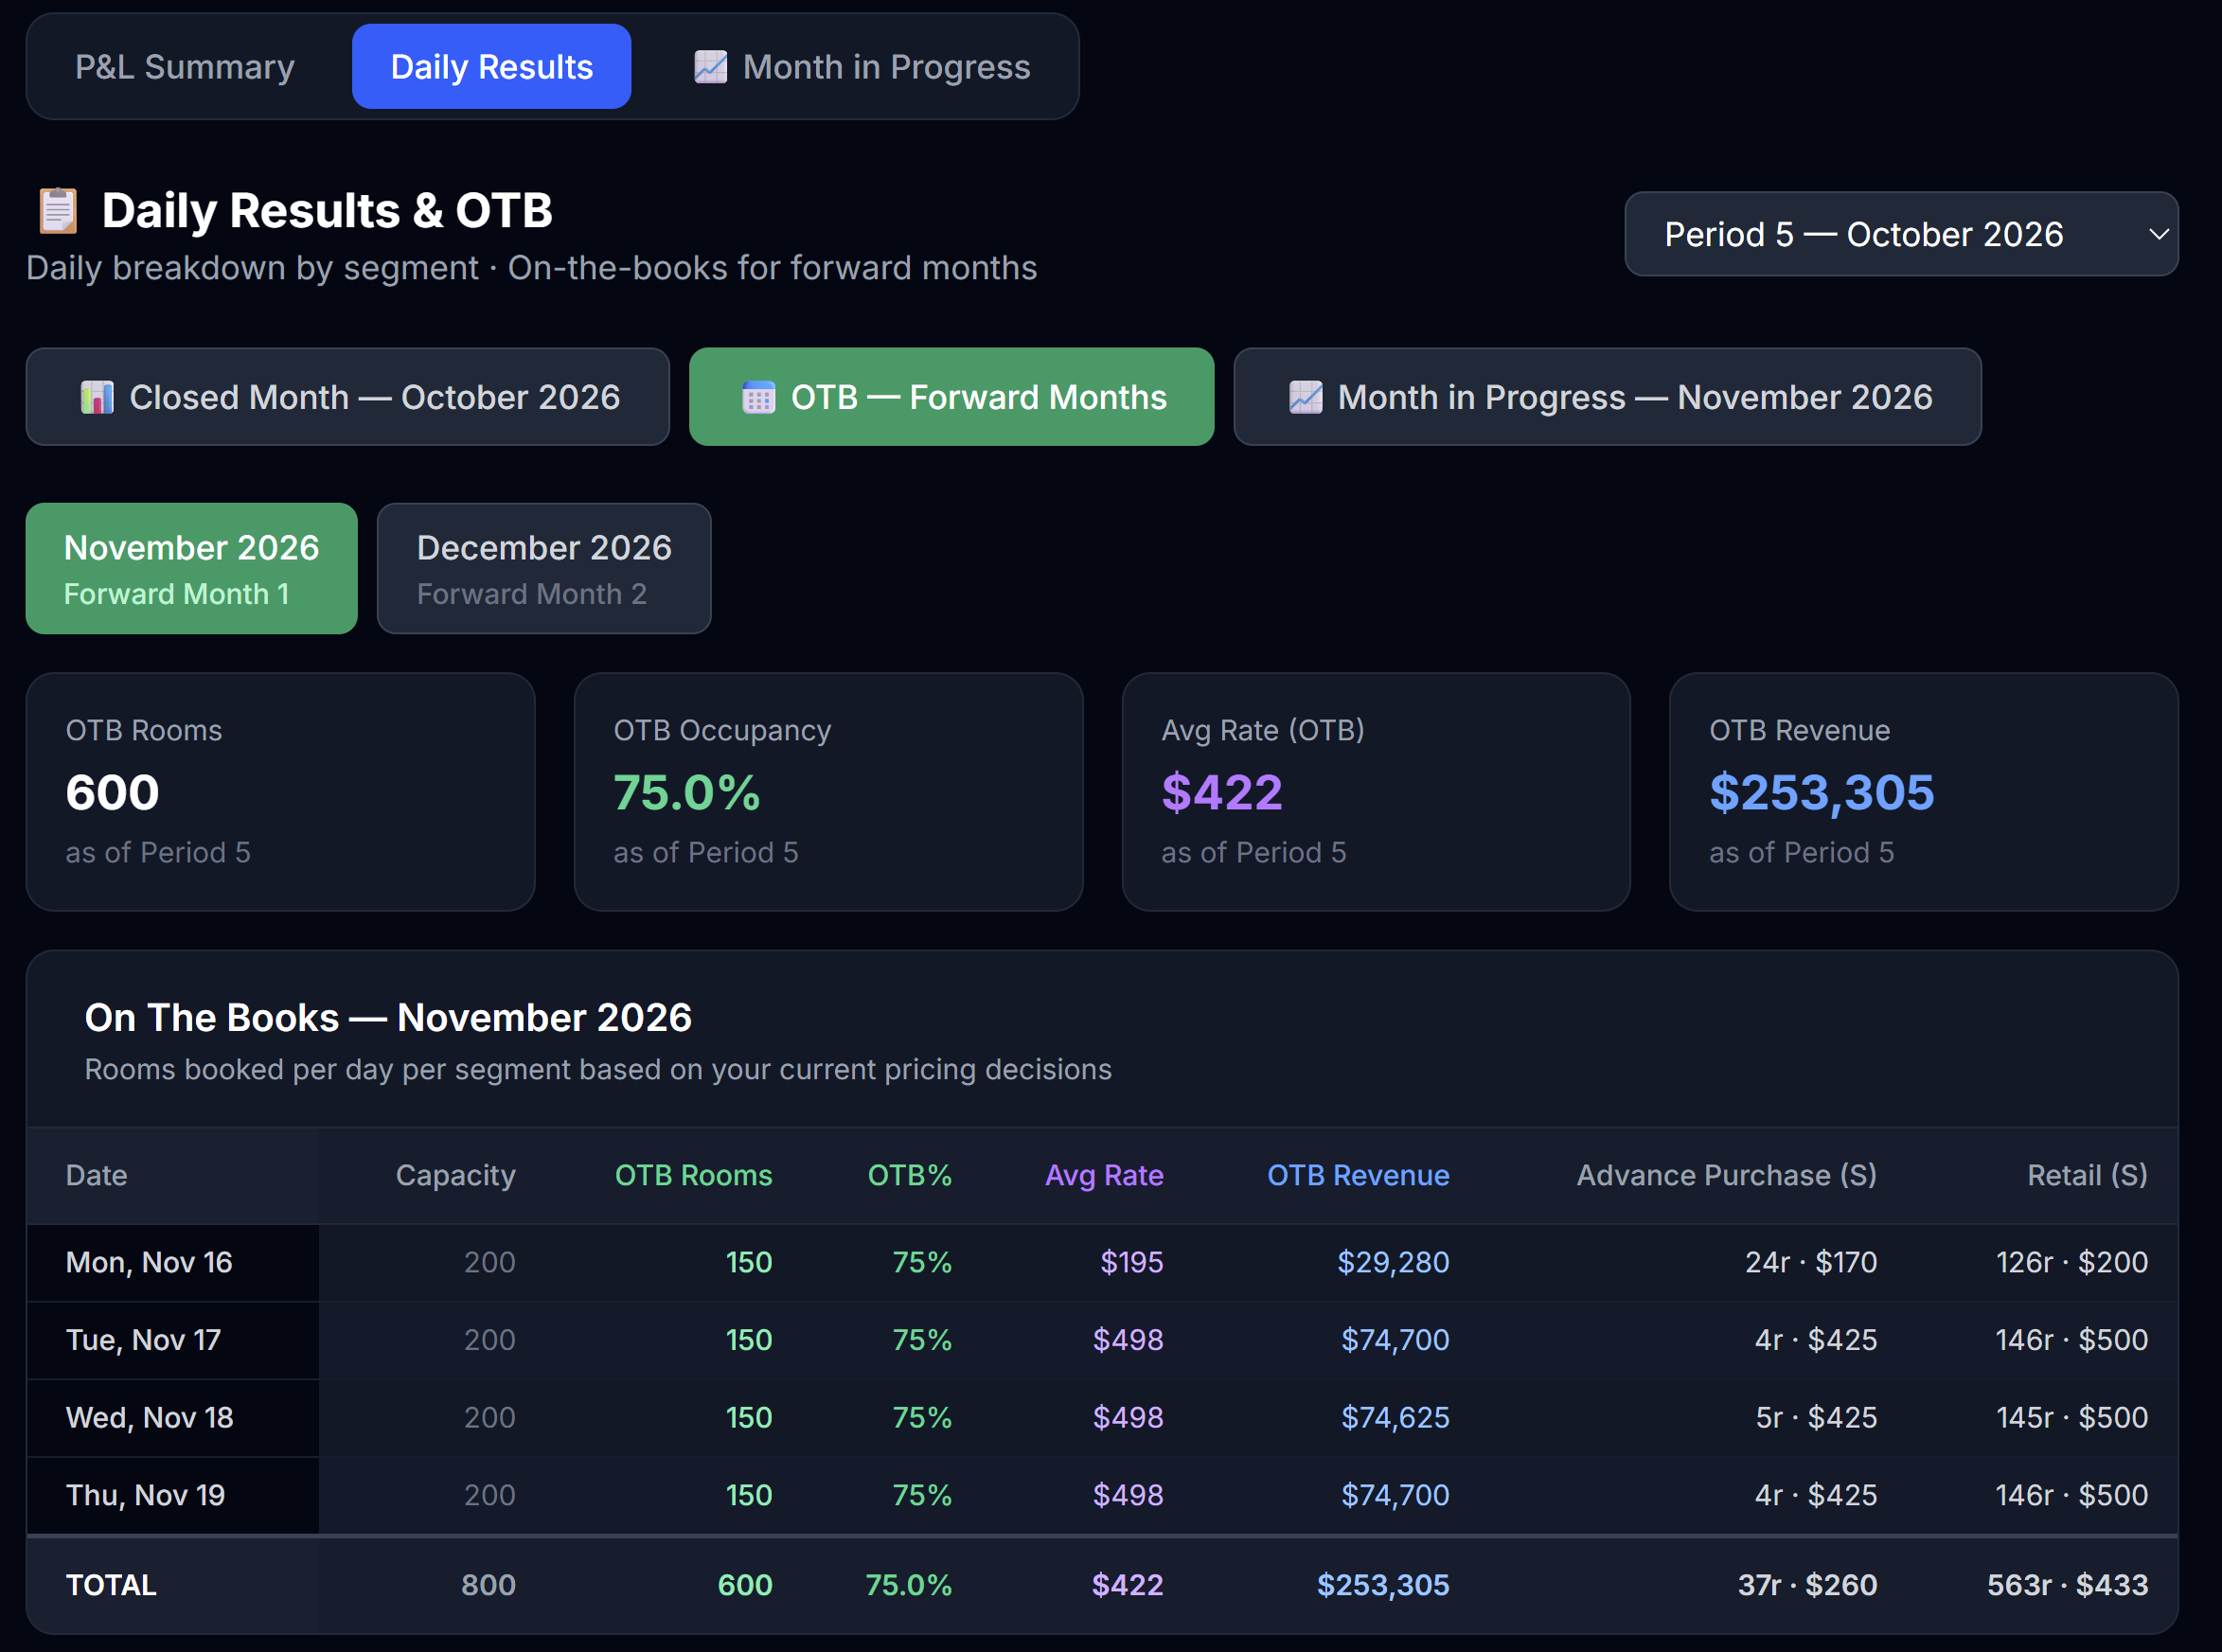 OTB for upcoming months. Useful for forward planning.
This matters for two reasons:
- Capacity planning — if you already have 200 OTB rooms for a Friday in 3 months, you can't sell those rooms again on the open market. The Forecast tab on Decisions surfaces these OTB numbers next to your forecast cells; seeing the same numbers here helps you sanity-check your forecasts.
- Strategy validation — large OTB means your corporate / group strategy is working. Empty OTB means you should consider bidding more aggressively on RFPs.
6.4 Market Intel — the market around you
The Market Intel tab keeps everything about your competitors in one place, separate from your own results. The Compset comes first on this tab — it's the intelligence you paid for, so it leads — followed by your STR indices and the competitor pricing grid:
- The Compset — competitive intelligence on every hotel: stars (shown as a precise decimal, e.g. 4.2), and — depending on the Market Research tier you've unlocked — reputation, distribution channels, amenities, and the marketing campaigns they've run. How much you see depends on what you bought; see Chapter 4 (4.4) for how Market Research and the tiers work. Whatever level you've unlocked here is the same level you see on Decisions — buy once, and it's visible everywhere the compset shows up.
- Your STR indices (MPI / ARI / RGI) for the period — the same benchmark scores described in 6.1, surfaced here because they're fundamentally a vs-the-market read.
- Competitor pricing — a daily grid of what each hotel is charging. You can filter it by segment (Retail / Advance Purchase) and room type (Standard / Premium); it opens on Retail · Standard. Your column is highlighted, and cells are tinted green/red versus the competitors' average so an over- or under-priced day jumps out.
💡 Stars here are fractional: a hotel at 4.2 stars is meaningfully different from one at 4.8. Read the decimal, not just the rounded star count — it tells you how much product quality separates you from a rival.
6.5 Month in Progress (pace mode only)
If your simulation uses pace mode, there's a third tab: Month in Progress.
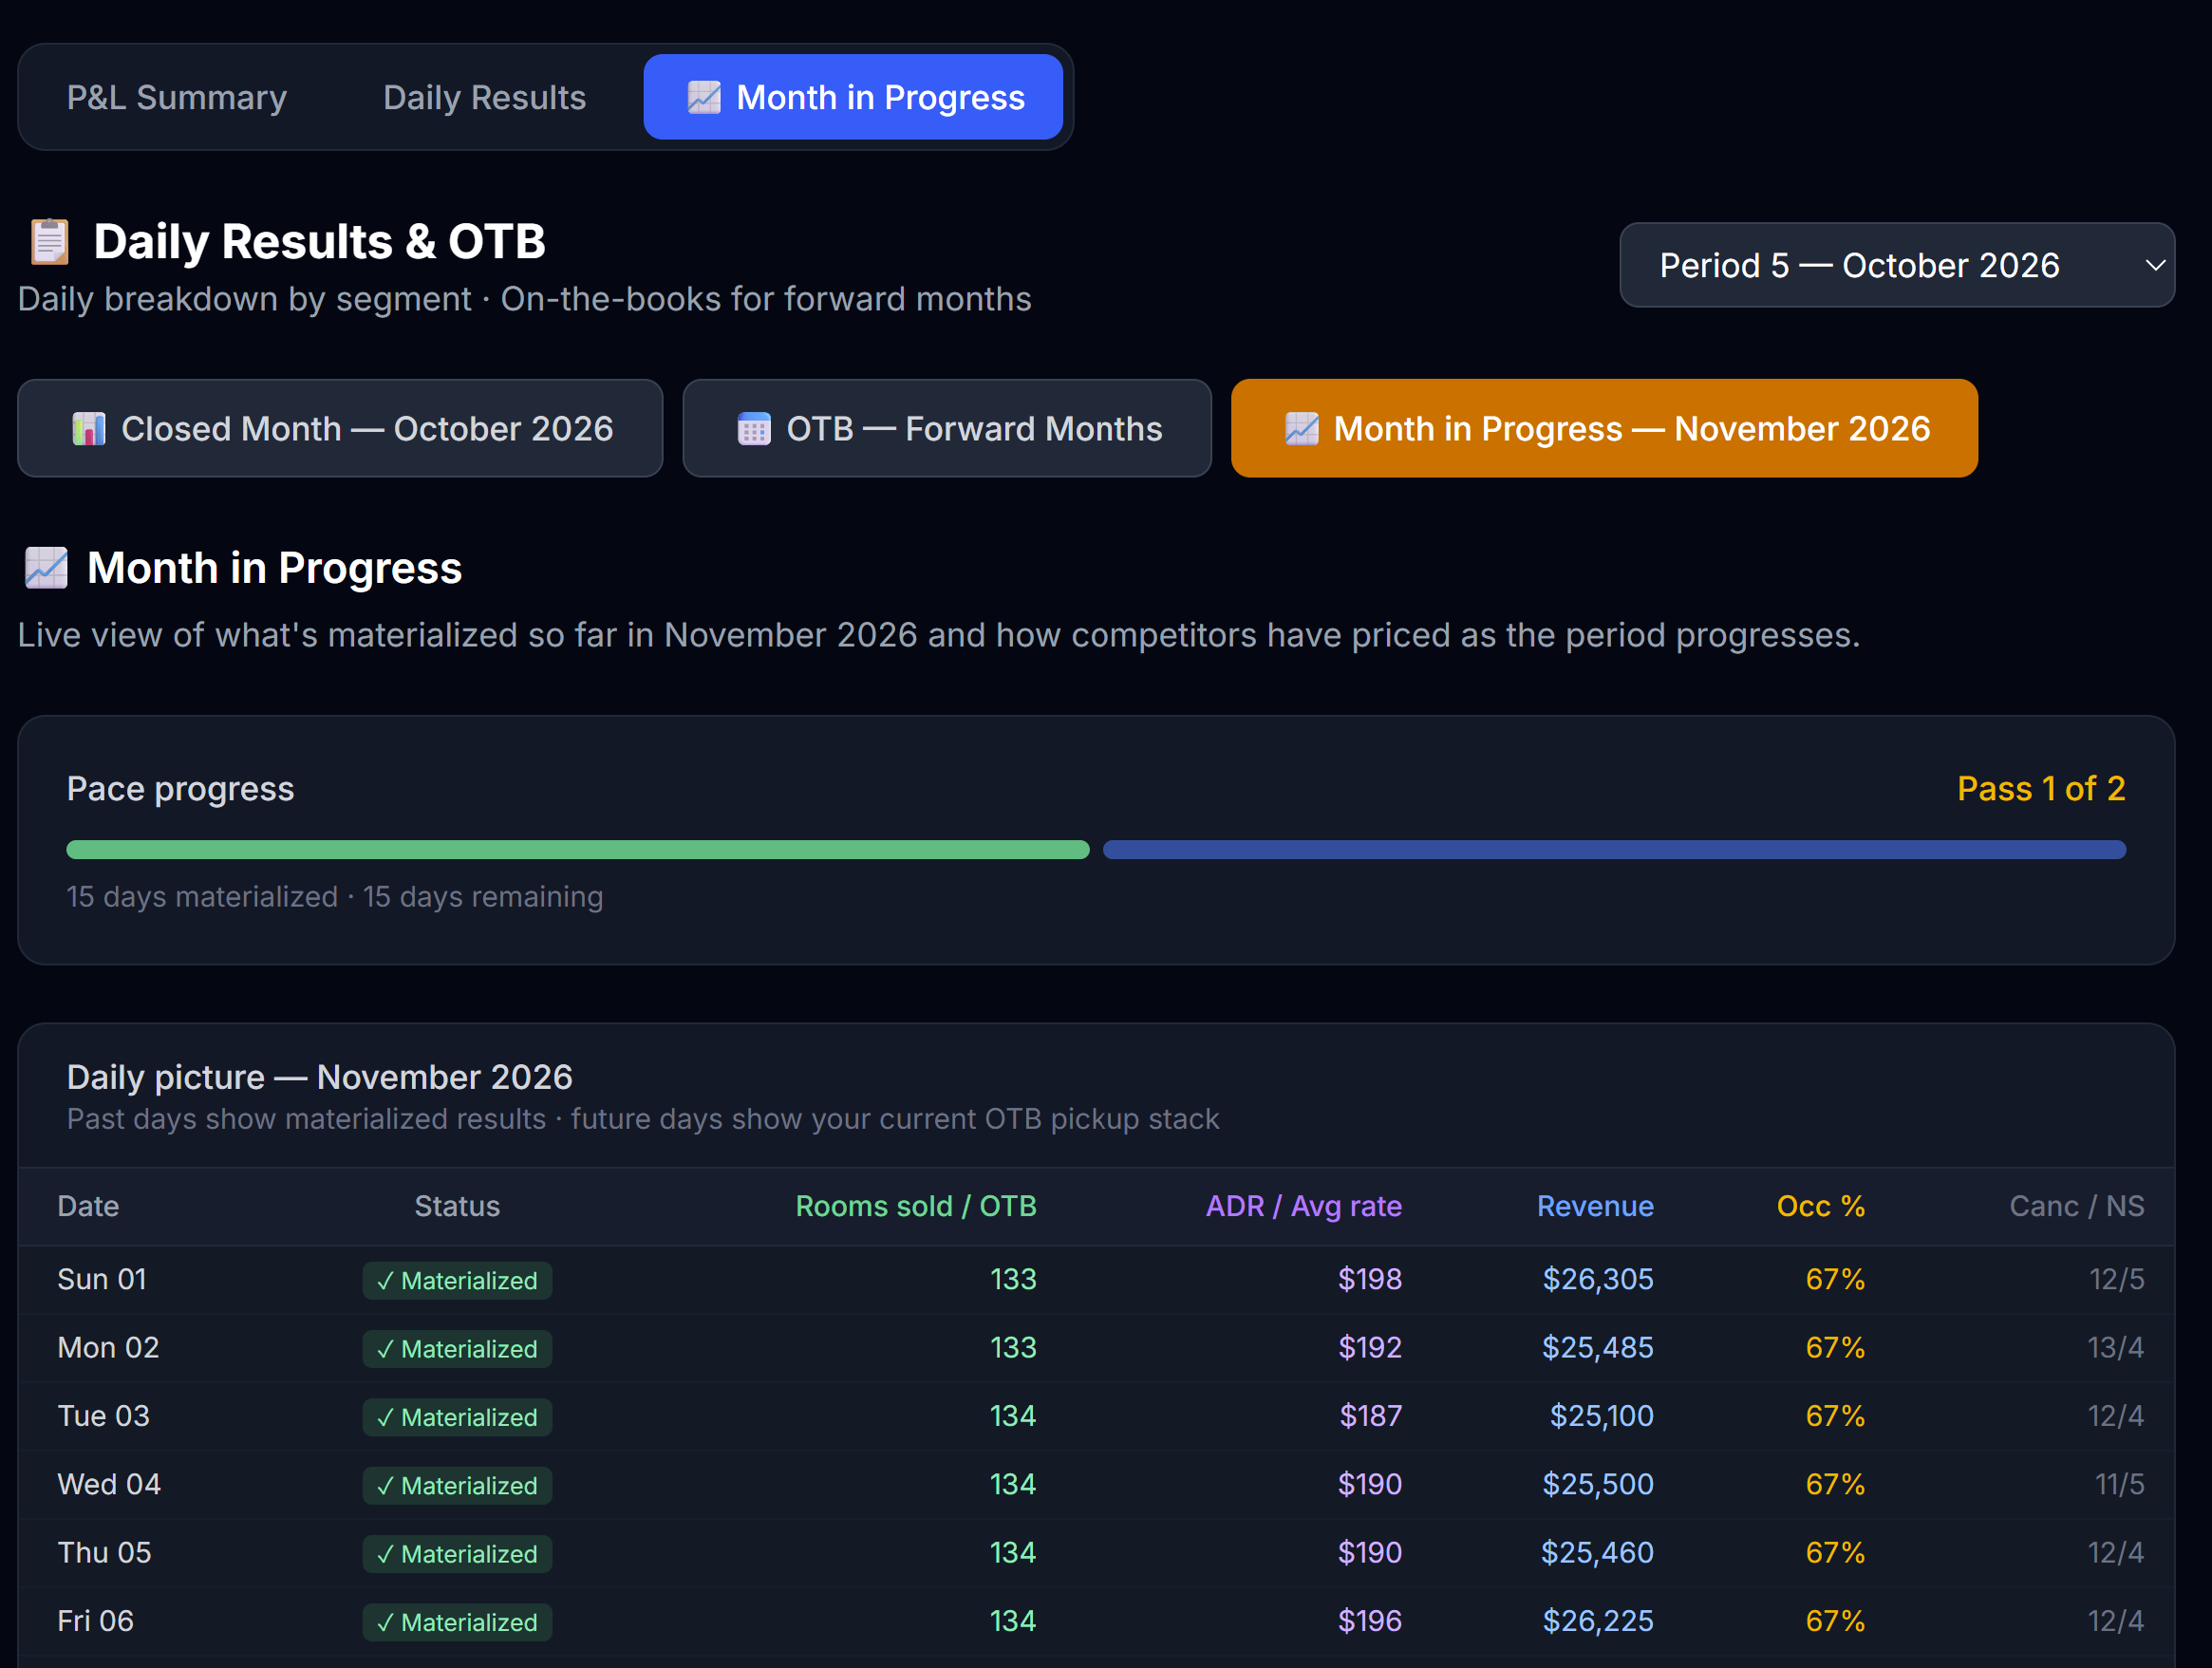 Month in Progress shows partially-run periods with the days that have closed so far.
It shows the open period day by day — closed days with real materialized results, open days with your current on-the-books (OTB) pickup. Three things to use here:
- Live STR indices (MPI / ARI / RGI) computed over the days closed so far — your standing vs the market mid-month, before the period publishes. They move as more days close, and aren't final until the month closes.
- The daily split by room type (Std / Prem) and, behind the ▸ Segments toggle, by segment — so you can see exactly where demand is landing as the month builds, on both closed and OTB days.
- Competitor pricing — each hotel's latest rate per day, filterable by segment and room type (defaults to Retail · Standard).
It's the same Month in Progress view as on the Decisions page (covered in Chapter 7) — surfaced in both places for convenience. Use it between pace passes to spot competitor moves and adjust your remaining days.
6.6 Download to Excel
At the top of every one of the four results screens — General Results, Daily Results, Market Intel, and Month in Progress — there's a ⬇ Download Excel button. It generates a clean, well-structured workbook so you can analyze your numbers your own way — pivot tables, charts, your own formulas.
The workbook has one sheet per table:
| Sheet | What's in it |
|---|---|
| Read me | A glossary explaining every term (ADR, RevPAR, OTB, occupancy, no-show, etc.). |
| P&L | Your full Profit & Loss for every published month side by side, plus a cumulative total and the operating KPIs (including TRevPAR, GOPPAR, CPOR, and flow-through). |
| STR Indices | MPI / ARI / RGI per period — how you compare to the market (100 = at market). Includes a live "in progress" row for the open period. |
| Daily Results | The selected period's daily breakdown: physical vs available rooms, every segment (rooms and revenue), Std/Prem sold, occupancy, ADR, and totals. |
| Month in Progress | If a pace period is open, the live day-by-day picture, now split by segment and by room type (Std / Prem): closed days with real results, open days with your current OTB pickup. |
| Competitor Pricing | If a pace period is open, each hotel's latest rate per day, grouped into blocks by segment (Retail, Advance Purchase) and room type (Standard, Premium) — how the market is pricing as the month unfolds. |
| Compset | The competitive intelligence you've unlocked via Market Research: stars, and (by tier) reputation, channels, amenities, and campaigns. "Locked" cells need a higher tier. |
| OTB (forward) | All your forward bookings on the books, by day and segment. |
| Forecast Accuracy | Your forecast score for every published period, split into rooms and revenue. |
Scope: the Daily Results and OTB sheets cover the period selected in the dropdown; the P&L and Forecast sheets cover all published periods so you can see trends. Want another period's daily detail? Switch the dropdown and download again.
6.7 Cross-period analysis
The most powerful learning comes from looking at multiple periods side by side. The fastest route is the Excel download above — its P&L sheet already lays every published month next to each other. From there:
- Chart your operating profit, occupancy, and ADR across the months
- Watch the trends — operating profit climbing? Occupancy slipping? ADR stalling?
Trends matter more than any single period.
What to do with what you learn
Reading results without acting on them is wasted time. Before you close the Results tab, write yourself one note: "Next period I will ___."
Examples:
- "Next period I will price weekends 10% higher — I sold out every Friday."
- "Next period I will activate one OTA — my channel mix is too narrow."
- "Next period I will upgrade my F&B amenity — service score is dragging."
- "Next period I will not run that one-shot promo — payback was negative."
Pin that note somewhere. Read it when the next period opens.
Next
→ Chapter 7: Month in Progress (pace mode) — skip if your sim doesn't use pace mode